
Do the arithmetic on a mobile games portfolio.
Twenty titles. Two hours to pull a real picture of any one of them — attribution from one dashboard, in-game events from another, ad revenue from a third, reconciled in a spreadsheet. To look at the whole portfolio once is forty analyst-hours. Every day.
Nobody has forty hours a day. So the portfolio gets triaged: the two biggest earners are watched closely, and eighteen games run on instinct, a store rating, and whatever the marketing dashboard says in isolation.
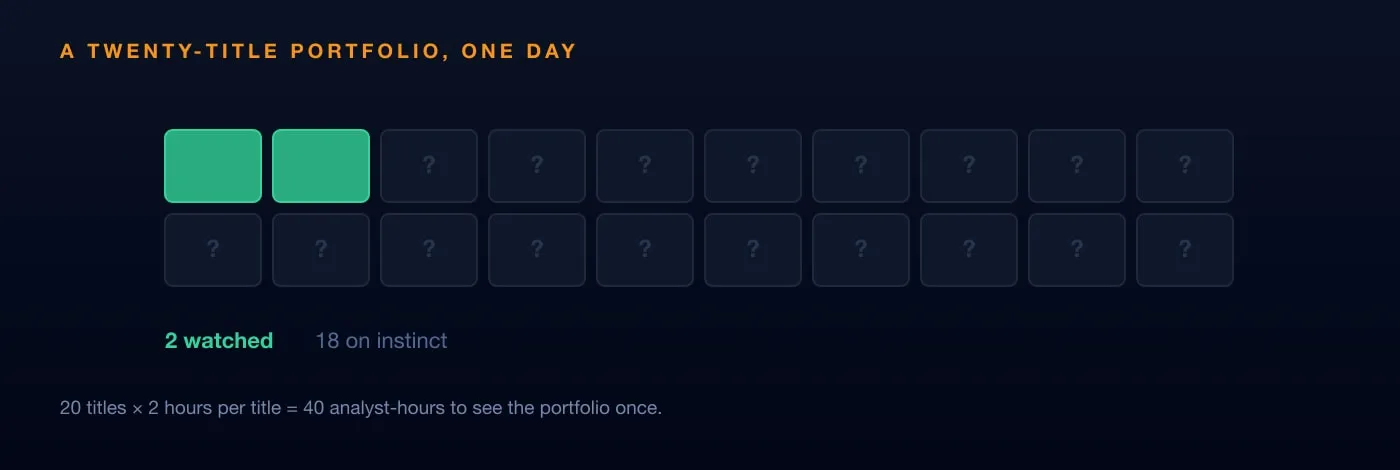
That is the real constraint in game analytics, and it is not a volume problem. The data is all there. It is in three places that do not join.
Why it takes two hours
A mobile game’s economics are split across systems that each see one third of the story:
| System | What it knows | What it cannot know |
|---|---|---|
| Attribution (AppsFlyer, Adjust) | Which campaign brought the install, what it cost | What the player did afterwards |
| In-game events (Firebase, GameAnalytics) | Sessions, levels, funnel drop-off, IAP | Where the player came from, or what they cost |
| Ad revenue (AppLovin MAX, ironSource) | Impressions and eCPM per placement | Which acquisition source those viewers came from |
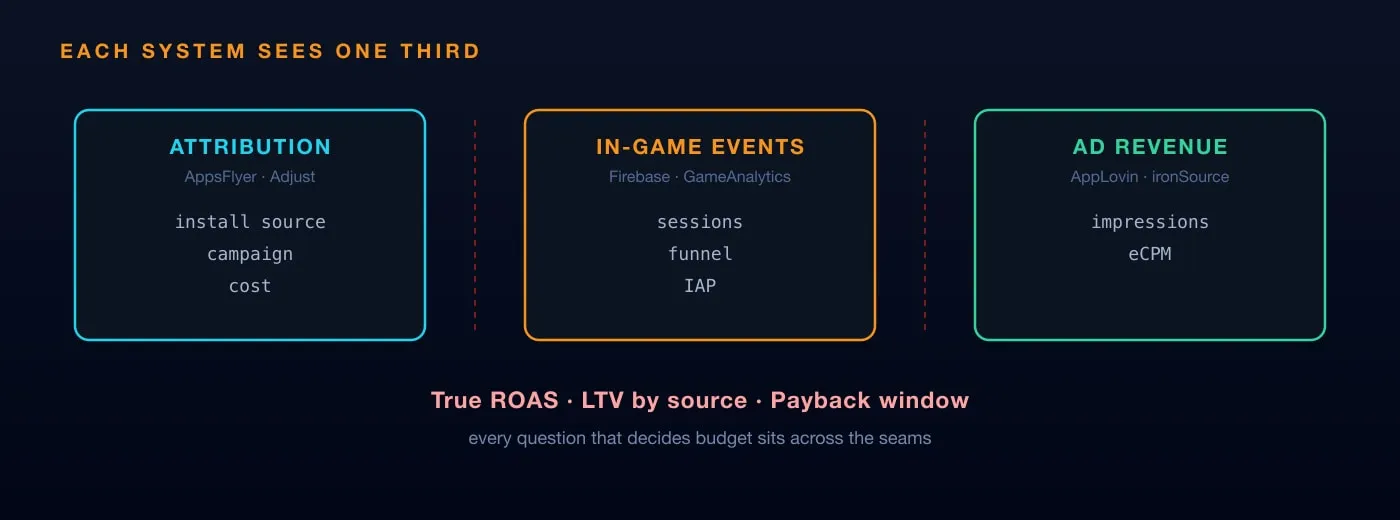
None of them is wrong. Each is complete about its own third. But the questions that decide budget all sit across the seams:
- True ROAS needs install cost from one system and IAP plus ad revenue from two others.
- LTV by source needs acquisition source joined to months of downstream behaviour.
- Payback window needs all three, ordered by time.
Those joins are the two hours. Not the querying — the exporting, matching on inconsistent IDs, and resolving the fact that three systems disagree about what a day is.
What the join has to produce
A single grain: one row per player per day, carrying acquisition source, campaign, cost allocation, in-game activity and revenue from both IAP and ads.
Once that table exists, the expensive questions become ordinary queries:
-- Payback by acquisition cohort: how many days until a campaign
-- returns what it cost, across every title at once.
select
  game, install_month, media_source,
  sum(spend)                                   as acquisition_cost,
  sum(iap_revenue + ad_revenue)                as revenue_to_date,
  sum(iap_revenue + ad_revenue) / sum(spend)   as roas,
  min(case when running_revenue >= running_spend
           then days_since_install end)        as payback_days
from player_day_model
group by game, install_month, media_source
The query is unremarkable. Everything hard happened before it — which is the point. The analysis was never the difficult part.
What changes when it exists
Joygame publishes more than twenty titles and works with over fifteen studios. Before centralising, two games out of twenty could be analysed in depth on any given day, each taking over two hours.
After the three sources were joined into one model, the numbers they report are:
- 3x more successful titles — because every game is evaluated daily instead of two, so winners are caught while there is still budget to push them
- 50% lower data management cost — the manual reporting pipeline stopped existing
- Minutes instead of hours per game, across the whole portfolio
- Predictive LTV became possible at all, which needs clean joined history and cannot be retrofitted onto exports
The third bullet is the one that produces the first. Cutting per-game analysis from two hours to minutes does not just save time; it changes which games get looked at, and a game nobody looks at cannot be scaled.

The metrics worth the effort
With a joined model, these stop being separate reports and become dimensions of one table:
D1 / D7 / D30 retention, by acquisition source. Blended retention across sources tells you almost nothing — a cheap source with poor D7 and an expensive one with strong D30 average into a number that describes neither. This is the same problem cohorts solve everywhere, with install source as the cohort dimension.
ARPDAU split by IAP and ads. One number hides whether a change to ad placement cannibalised purchases.
Payback window, not just ROAS. ROAS at day 7 and ROAS at day 90 lead to opposite UA decisions. The useful figure is how long until a cohort pays back.
Funnel drop-off by level, by cohort. Where players stop, compared across the versions they landed on — which is how you learn whether the change you shipped helped.
What to build first
Not a dashboard. The player-day model.
Get attribution, in-game events and ad revenue landing automatically into one warehouse, reconciled to a shared definition of player and day, with the checks that catch a source silently changing shape. Dashboards built on that are a weekend of work; dashboards built on exports are a permanent job.
The takeaway
Game analytics does not fail for want of data — a mobile title generates more events in a week than most companies see in a year. It fails because the three systems holding it were never designed to be joined, and joining them by hand costs more per title than most portfolios can afford.
Fix the join and the rest is querying.
That is the work Datablast does for mobile games studios: automated collection from attribution, ad networks and stores, normalised into one model where every title can be compared against every other, on the same definitions, every day.
Originally published on datablast.io in September 2023. Rewritten September 2026.
See it on your own data
20 minutes, your questions, a live walkthrough.